|
|
|
 www.design-reuse-embedded.com
 |
|

Overall GPU shipments increased 9.3% from last quarter, AMD increased 8% Nvidia increased 30%
Overall GPU shipments increased 9.3% from last quarter, AMD increased 8% Nvidia increased 30%
Year-to-year total GPU shipments decreased -3.3%, desktop graphics increased 2%, notebooks decreased -6%.
November 20, 2017 -- The desktop gain is attributed to gaming and cryptocurrency. That helped AMD and Nvidia gain market share.
This is the latest report from Jon Peddie Research on the GPUs used in PCs. It is reporting on the results of Q3'17 GPU shipments world-wide.

The third quarter is typically the strongest from the previous quarter in the seasonal cycles of the past. For Q3'17 it increased 9.3% from last quarter, and was below the ten-year average of 9.52%.
Quick highlights:
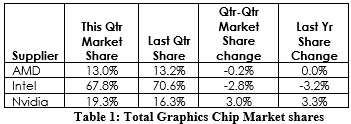
- AMD’s overall unit shipments increased 7.63% quarter-to-quarter, Intel’s total shipments increased 5.01% from last quarter, and Nvidia’s increased 29.53%.
- The attach rate of GPUs (includes integrated and discrete GPUs) to PCs for the quarter was 144% which was down -1.28% from last quarter.
- Discrete GPUs were in 39.55% of PCs, which is up 4.18%.
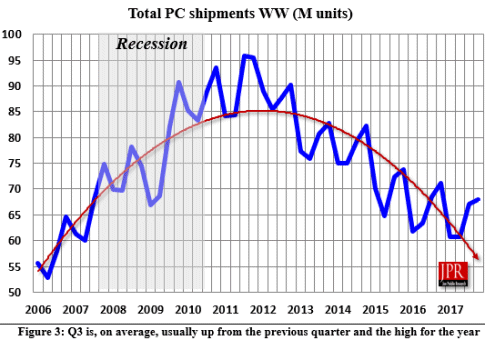
- The overall PC market increase 10.31% quarter-to-quarter, and decrease -2.06% year-to-year.
- Desktop graphics add-in boards (AIBs) that use discrete GPUs increased 29.05% from last quarter.
- Q3'17 saw an increase in tablet shipments from last quarter.
As mentioned, the normal seasonality has re-established itself in the PC market, albeit in a slowly declining way.

GPUs are traditionally a leading indicator of the market, since a GPU goes into every system before it is shipped, and most of the PC vendors are guiding cautiously for Q4’14.
The Gaming PC segment, where higher-end GPUs are used, was once again the bright spot in the market in the quarter.
The quarter in general
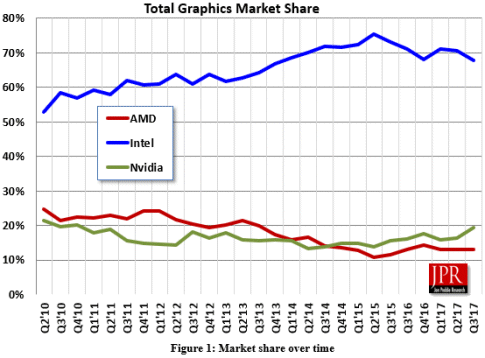
AMD’s shipments of desktop heterogeneous GPU/CPUs, i.e., APUs, increased 7.1% from the previous quarter. AMD's notebook APU shipments were up 2.2%. Desktop discrete GPUs increased 16.1% from last quarter, and notebook discrete shipments increased 5.2%. AMD’s total PC graphics shipments increased 7.6% from the previous quarter.
Intel’s desktop processor graphics shipments increased from last quarter by 5.0% and notebook processors increased by 5.9%, and total PC graphics shipments increased 5.0% from last quarter.
Nvidia’s discrete desktop GPU shipments were up 34.7% from last quarter; and the company’s discrete notebook GPU shipments increased 22.4%, and total PC graphics shipments increased 29.5% from last quarter.
Total discrete GPUs (desktop and notebook) shipments for the industry increased 23.3% from the last quarter, and increased 11.7% from last year. Sales of discrete GPUs fluctuate due to a variety of factors (timing, memory pricing, etc.), new product introductions, and the influence of integrated graphics. Overall, 5-year forecasted CAGR is now -5.8%, which is down from -4.5% last year.
Ninety nine percent of Intel’s non-server processors have graphics, and over 66% of AMD’s non-server processors contain integrated graphics; AMD still ships integrated graphics chipsets (IGPs).

Graphics chips (GPUs) and chips with graphics (IGPs, APUs, and EPGs) GPUs shipments are a leading indicator for the PC market. At least one and often two GPUs are present in every PC shipped. It can take the form of a discrete chip, a GPU integrated in the chipset or embedded in the CPU. The average has grown from 1.2 GPUs per PC in 2001 to 1.44 GPUs per PC.
JPR’s detailed 81-page Market Watch report will provide you with all the data, analysis and insight you need to clearly understand where this technology is today and where it's headed.
Our findings include discrete and integrated graphics (CPU and chipset) for Desktops, Notebooks (and Netbooks). It does not include iPad and Android-based tablets, or Arm-based Servers, or x86-based servers. It does include x86-based tablets, Chromebooks, and embedded systems.
GPUs are traditionally a leading indicator of the market, since a GPU goes into every non-server system before it is shipped, and most of the PC vendors are guiding cautiously for Q4’14. The Gaming PC segment, where higher-end GPUs are used, was a bright spot in the market in the quarter.
For those who wish to understand the PC market, an understanding of the highly complex technology and ecosystem that has been built around the GPU is essential to understanding the market’s future directions.
The report contains the following content:
- Worldwide GPU and PC Shipment Volume, 1994 to 2020.
- Detailed worldwide GPU Shipment Volume, 1Q 2001 to 2Q 2016, and forecast to 2020.
- Major suppliers: Detailed market share data-on the shipments of AMD, Intel, Nvidia, and others.
- Financial results for the leading suppliers: Analysis of the quarterly results of the leading GPU suppliers
- Market Forecasts: You will also be able to download a detailed spreadsheet and supporting charts that project the supplier’s shipments over the period 2001 to 2018. Projections are split into platforms and GPU type.
- GPUs: History, Status, and Analysis.
- Financial History from for the last nine quarter: Based on historic SEC filings, you can see current and historical sales and profit results of the leading suppliers.
- A Vision of the future: Building upon a solid foundation of facts, data and sober analysis, this section pulls together all of the report's findings and paints a vivid picture of where the PC graphics market is headed.
- Charts, graphics, tables and more: Included with this report is an Excel workbook. It contains the data we used to create the charts in this report. The workbook has the charts and supplemental information.
JPR also publishes a series of reports on the PC Gaming Hardware Market, which covers the total market including system and accessories, and looks at 31 countries. More information can be found here: https://www.jonpeddie.com/store/worldwide-pc-gaming-hardware-market-report-series-total
Pricing and Availability
The Jon Peddie Research's Market Watch is available now in both electronic and hard copy editions, and sells for $2,500. Included with this report is an Excel workbook with the data used to create the charts, the charts themselves, and supplemental information. The annual subscription price for JPR's Market Watch is $5,000 and includes four quarterly issues. Full subscribers to JPR services receive Tech Watch (the company's bi-weekly report) and a copy of Market Watch as part of their subscription.
Click here to learn more about this major report. Or, for more information call 415/435-9368 or visit the Jon Peddie Research website at www.jonpeddie.com.
Contact Robert Dow at JPR (Robert@jonpeddie.com) for a free sample of TechWatch.
About Jon Peddie Research
Dr. Jon Peddie has been active in the graphics and multimedia fields for more than 30 years. Jon Peddie Research is a technically oriented multimedia and graphics research and consulting firm. Based in Tiburon, California, JPR provides consulting, research, and other specialized services to technology companies in a variety of fields including graphics development, multimedia for professional applications and consumer electronics, high-end computing, and Internet-access product development. Jon Peddie'sMarket Watch is a quarterly report focused on the market activity of PC graphics controllers for notebook and desktop computing.
 Back
Back Contact Us